Java 实用工具类Spring 的 StopWatch常用方法
前言
在日常开发中,我们经常需要对代码的执行耗时进行监控和分析。spring 提供了一个轻量级的计时工具类:org.springframework.util.stopwatch,可以非常方便地实现多个任务的精确耗时统计,尤其适用于性能调优与调试分析场景。
一、stopwatch 简介
stopwatch 是 spring core 中的一个实用类,用于对代码执行过程中的多个阶段进行计时和结果统计。它支持任务分段记录、总耗时统计、任务名称记录等功能。
二、stopwatch 的常用方法
1. 构造方法
stopwatch stopwatch = new stopwatch("performance-monitor");
参数可选,用于命名当前计时器。
2. 开始一个任务
stopwatch.start("task1");
开始记录一个任务,并命名该任务。
3. 停止当前任务
stopwatch.stop();
停止当前正在记录的任务。
4. 判断状态
stopwatch.isrunning();
判断当前是否还有任务在运行。
5. 获取统计信息
stopwatch.prettyprint(); // 打印所有任务及耗时信息(格式化)
stopwatch.gettotaltimemillis(); // 总耗时(毫秒)
stopwatch.gettaskcount(); // 获取任务数
6. 获取具体任务信息
taskinfo[] tasks = stopwatch.gettaskinfo();
for (taskinfo task : tasks) {
    system.out.println(task.gettaskname() + ": " + task.gettimemillis());
}
三、常见使用场景
1. 性能瓶颈排查
在复杂方法中插入多个 stopwatch.start("stepx") 记录各阶段耗时。
stopwatch sw = new stopwatch();
sw.start("loaddb");
loadfromdatabase();
sw.stop();
sw.start("parsejson");
parsejsondata();
sw.stop();
system.out.println(sw.prettyprint());
2. 接口性能统计
可用于拦截器、过滤器等,对接口整体和各子流程耗时进行统计。
3. 单元测试性能分析
在测试代码中评估某个方法调用的稳定性和耗时情况。
4. 多线程任务分析(注意线程隔离)
在并发场景下,不建议多个线程共用一个 stopwatch 实例,应为每个线程独立创建实例。
四、与 system.currenttimemillis() 的对比优势
| 功能 | system.currenttimemillis() | stopwatch |
|---|---|---|
| api 简洁 | 非常原始 | 封装好任务名、阶段 |
| 支持多任务 | 手动维护多个变量 | 内部支持任务堆栈 |
| 输出格式 | 自定义打印 | prettyprint统一美观 |
| 可读性 | 差 | 高,可读性好 |
五、总结
stopwatch 是 spring 框架中极其实用的开发辅助工具,它为性能分析和调试提供了轻量但强大的能力,使用简单、无需复杂配置。
建议在接口调用链、框架扩展点、自定义组件等性能敏感区域,结合日志系统或 apm 工具使用 stopwatch,帮助我们在开发阶段快速定位瓶颈、量化优化效果。
贴士:不要在生产环境中滥用
stopwatch.prettyprint(),可以定向输出日志或结合自定义日志格式收集信息更为合适。
到此这篇关于java 实用工具类:spring 的 stopwatch的文章就介绍到这了,更多相关java stopwatch内容请搜索代码网以前的文章或继续浏览下面的相关文章希望大家以后多多支持代码网!
热门文章
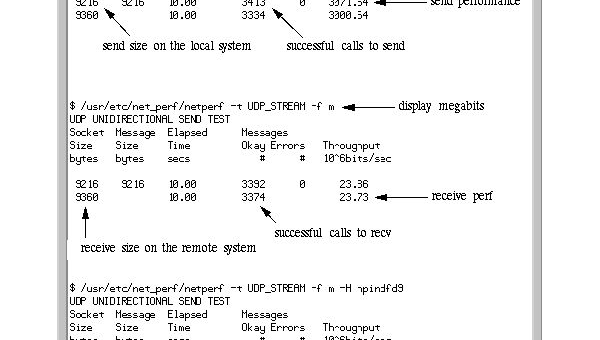
Linux怎样优化网络带宽使用
2025-04-20

如何手工制作台历?简单步骤与创意设计指南
2025-04-19
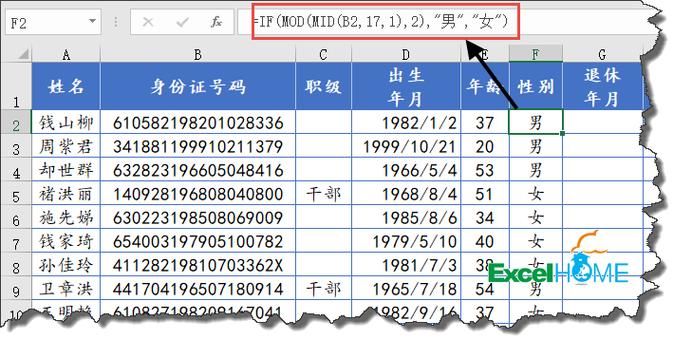
如何查询他人身份证号码?合法途径与注意事项解析
2025-04-19
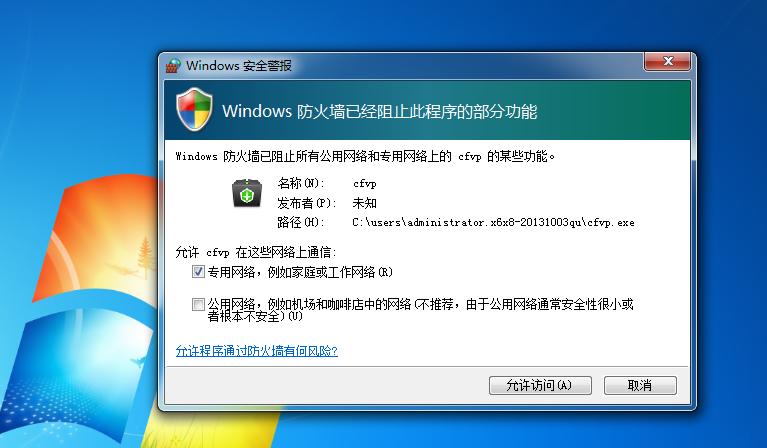
Windows防火墙打不开怎么办?全面解决方法
2025-04-14

Linux设置环境变量的方法?linux设置环境变量的命令
2025-04-11
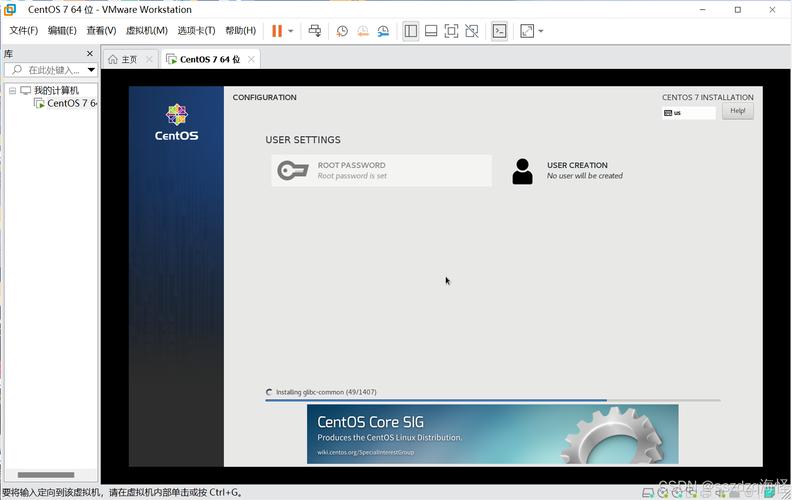
CentOS与Aliyun Linux有什么区别?如何选择最佳方案?
2025-03-24